
The quarterly cadence of reporting in business building has been in existence for as long as I can remember. Whether driven by habit or logic, quarterly data has always been the standard. But here’s the issue: think about how much you accomplish in a single day. Now multiply that by 90. It seems ridiculous to go that long without adjusting your approach, yet that’s exactly what happens with quarterly data. As it relates to GTM success, managing quarterly goals is like boarding a hope-fueled rollercoaster and closing your eyes. Predictable ARR becomes impossible, and the fiscal year turns into a chaotic top-to-bottom funnel whipsaw.
Quarterly planning usually plays out similarly to this:

… sound familiar?
Successful GTM motions are, by definition, highly iterative. If you wait months to adjust your strategy, you’ll miss critical warning signs and won’t make the necessary timely changes to achieve your targets, especially in the highly dynamic SaaS world.
For that reason, weekly activity management is non-negotiable in my book. It’s the only way to surface issues as soon as the change starts to occur, enabling the GTM team to quickly make adjustments instead of losing multiple quarters of revenue and momentum that could have been salvaged.
I frequently speak with marketing and revenue leaders who take the view that weekly activity management won’t work for them because there’s too much day-to-day noise that gets in the way. Even if the company is selling to massive enterprises with $1M+ ACVs and only a few closed deals per year, success still comes down to the small steps. Is the company doing the right things today, tomorrow, and the rest of this week to ensure success this month, quarter, and year? A weekly cadence allows you to detect early trends, make changes, and drive performance well before a bad quarter or year becomes inevitable.
The Two Most Important Types of Metrics to Track Weekly
What you track is just as important as how often you track it. My recommendation is to focus on two categories of metrics: pipeline data and activity. They each have pros and cons, but measured together, they’ll give you a good sense of both the quality and consistency of your sales funnel from top to bottom. Let’s take a look at both.
What is pipeline data?
I know the question seems very obvious, but there are nuances that I’d like to introduce. Most people who hear the phrase pipeline data think about a dollar amount of future potential revenue, by lead, segmented by stage. That is a useful way to evaluate opportunities, which I will refer to as the balance sheet method; i.e., a snapshot view of the measure of the value of deals you have in your pipeline at a given time. However, that is a very incomplete picture. To use an extreme, what if all pipeline opportunities fall out of the pipeline tomorrow? That leads to the need to understand the income statement method of pipeline data; i.e., how much new pipeline is created during a period of time. If I combine data from the balance sheet and income statement methods, I know both weekly progress as well as weekly value. Consequently, I can dramatically improve predictability, which provides tremendous air cover for building value consistently over time.
How about those activity metrics?
As mentioned above, there are some weaknesses with pipeline data alone. One of the primary weaknesses is the actual dollar value of each given opportunity. Ask yourself:
- Who creates that dollar value?
- What are the incentives around that dollar value?
- How accurate is it?
Depending upon the answers, the actual value of the pipeline could be vastly overstated. However, with the use of activity metrics, in combination with pipeline data, the company can protect itself from overstated pipeline value. If the pipeline data is overstated, the motion is still supported by consistent activity to generate, process, and close leads.
Here’s a quick example of how activity metrics can be used:
If the conversion rate of opportunity to close is approximately 10% over time, and I know my average contract value, then I know roughly how many opportunities I need to generate in a week to expect to hit my new logo goal. If I manage the efforts of the team to that activity metric, I can create predictability in my new ARR. So what are some examples of activities that should be tracked? Each company’s sales motion is a bit different, but some common examples are opportunities created, demos held, outbound calls, inbound calls, webinar attendees, proposals sent, etc. We’ll explore a few of these in more detail below.
How to Put Weekly Activity Management into Practice
Transitioning from quarterly to weekly activity management may take some time, but the predictability rewards will be well worth it. Here’s a step-by-step process to get you there.

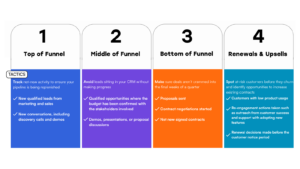
The first step in implementing weekly activity management is to determine the 3-5 key metrics that accurately measure a lead’s progress in your company’s sales motion. Each company’s motion is slightly different, and the appropriate metrics will differ from company to company. Moreover, the metrics must be consistently tracked and accurate without any data holes. Here are a few examples:
Top of Funnel
Goal: Track net-new activity to ensure your pipeline is being replenished
- New qualified leads from marketing and sales
- New conversations, including discovery calls and demos
- New stage 1 pipeline generated
Middle of Funnel
Goal: Avoid leads sitting in your CRM without making progress
- Qualified opportunities where budget has been confirmed and stakeholders are involved
- Demos, presentations, or proposal discussions
- New stage 2 or 3 pipeline generated
Bottom of Funnel
Goal: Make sure deals aren’t crammed into the final weeks of a quarter
- Proposals sent
- Contract negotiations started
- Net new signed contracts
- New stage 4 or 5 pipeline generated
Once the metrics are determined, you need to get the data tooling in place to observe the metrics and quickly draw accurate conclusions. One big piece of advice – keep it simple. You can automate and systematize the data later. Time is of the essence – get the data in a Google Sheet or Excel. Then, create a chart that shows each metric weekly going back for at least 6 months (ideally longer to utilize YOY comparisons). Now, your data is prepped and you can start to manage change.

The default is to immediately start comparing the metric (leads, closed/won, etc.) to the budget. While that can be helpful, the goal is not just to hit budget; the goal is to grow shareholder value (share price) by growing the business as fast as possible in an efficient way. With that in mind, you should create a definition of success that simply represents what you are trying to accomplish in the near term.
Let’s talk through an example and start with the metric that is highest in the funnel:
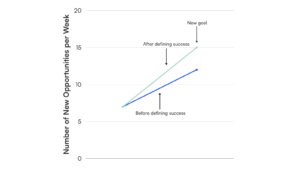
With a $25K ACV, let’s say the company has been creating 10 new opportunities a week, on average, and generally ranges between 7 and 12 opportunities per week. The first definition of success might be 15 new opportunities per week. Draw a horizontal line on the chart at 15. That’s the goal. How can the team get to 15 opportunities per week without sacrificing quality? What’s the bottleneck? Is it outbound calls? Is it marketing program spend? What about referral volume? You may need to spend a little bit of money, but achieve that definition of success quickly.
Ensure you create a definition of success for each metric you are tracking (this may seem obvious, but the definitions of success should be connected by virtue of conversion rates, unless conversion rate improvement is a key initiative for the company).

Given that measurements are weekly, instead of quarterly, you will achieve your definition of success at the top of the funnel in a relatively short period of time. At that point, look for the next bottleneck and ask yourself: Are the conversion rates holding? Is the company achieving the other definitions of success? Why or why not? Figure out the next barrier and quickly remove it. Bit by bit you will improve all metrics in the motion.

Here’s where it gets fun – as metrics improve and predictability takes hold, you now get to ask yourself: what are the new possibilities for the GTM motion? Put budget aside, as budget should not be the limiter on growth or success. What should the new definition of success be for each metric? Move up the horizontal line and continue to manage the bottlenecks. Your excellent GTM leadership will raise all boats, and the accounting and finance team’s budget work will rise in step with you.
A Quick Aside
The principles outlined above are not just for sales and marketing efforts. Customer success and support represent a highly applicable use case that can drive tremendous value for the company. Here’s a quick framework that may help:
Renewals and Upsells – Weekly Metrics Example
Goal: Detect at-risk customers before they churn and identify opportunities to increase existing contracts
- Customers who begin low product usage
- Re-engagement actions taken such as outreach from customer success to drive new feature adoption
- Customers who move from low product usage to high product usage
- Renewal decisions made before the customer notice period
Final Thoughts
As you transition to weekly activity management, expect to feel some resistance to the process yourself — and to get some pushback from your team. Change is hard, but missing your numbers every other quarter is much harder. If your goal is to get off the pipeline rollercoaster, consistency will always outperform last-minute scrambles.
In the quest for predictability in the GTM, weekly metric management is like the ultimate walking stick. It provides support and stability as you build consistent performance and improvement into the system. Good luck out there and please ping the Sorenson Capital team any time if you’d like to discuss further.
Link to the first post of the series : The Staffing Mistakes To Avoid When Ramping GTM